Examples
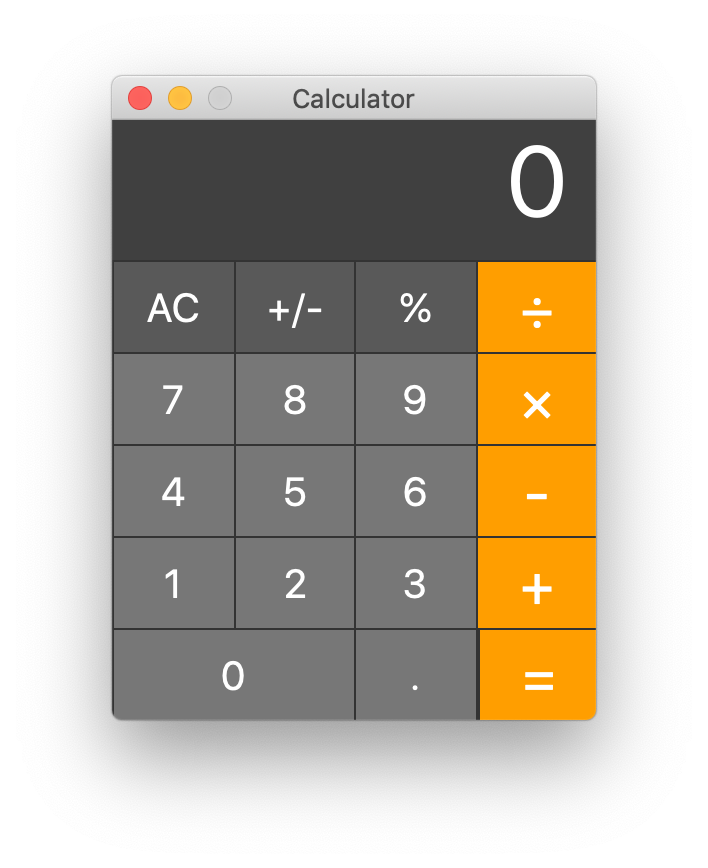
Calculator
It’s easy to create a good looking program with Edifice. In this example, we imitate the standard look of the Mac OS Calculator app in 100 lines of code (most of which is implementing the intricacies of the calculator state machine).
The code is available here.
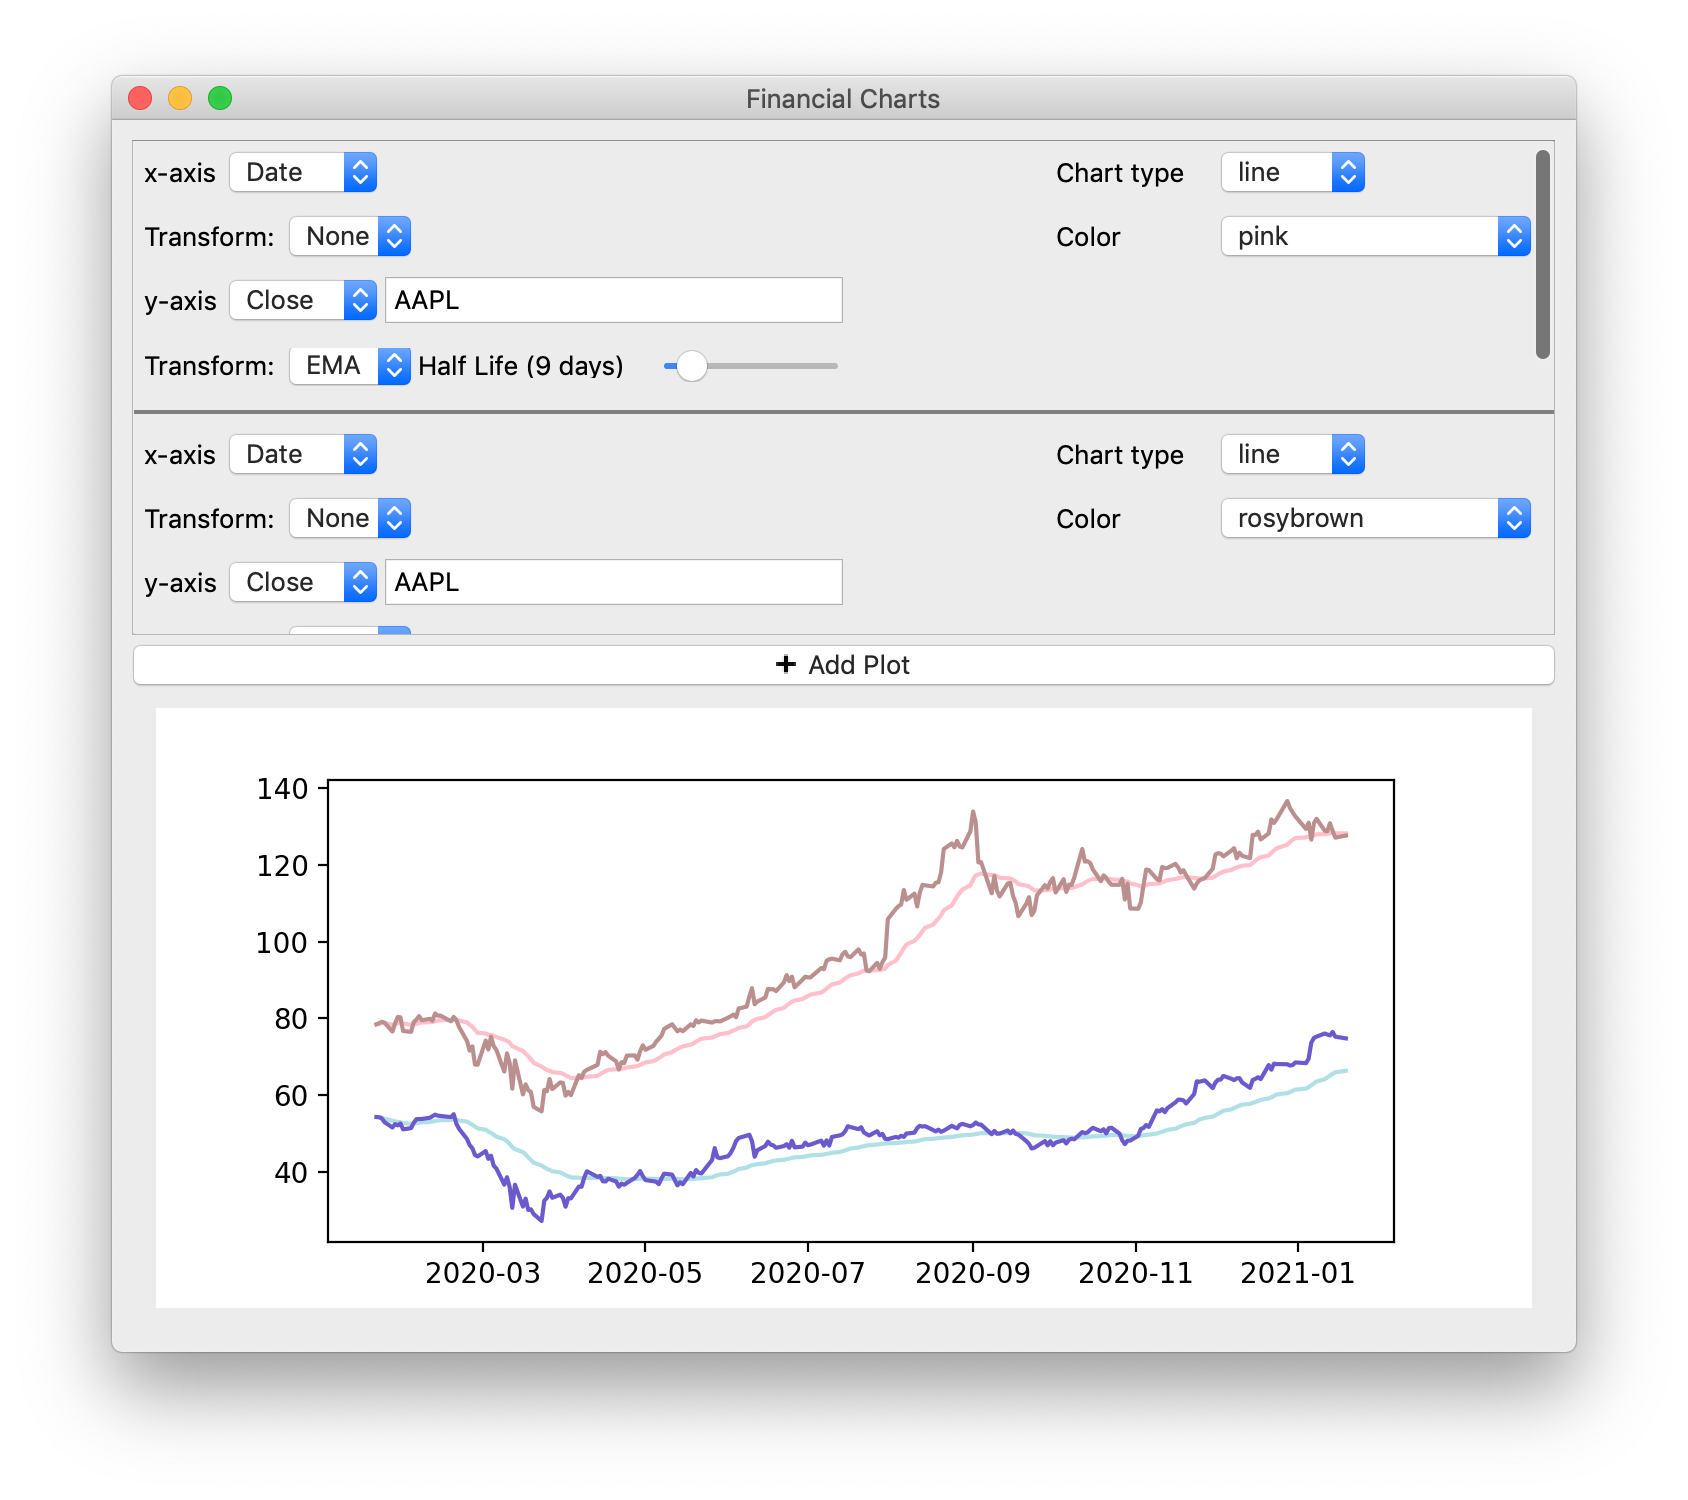
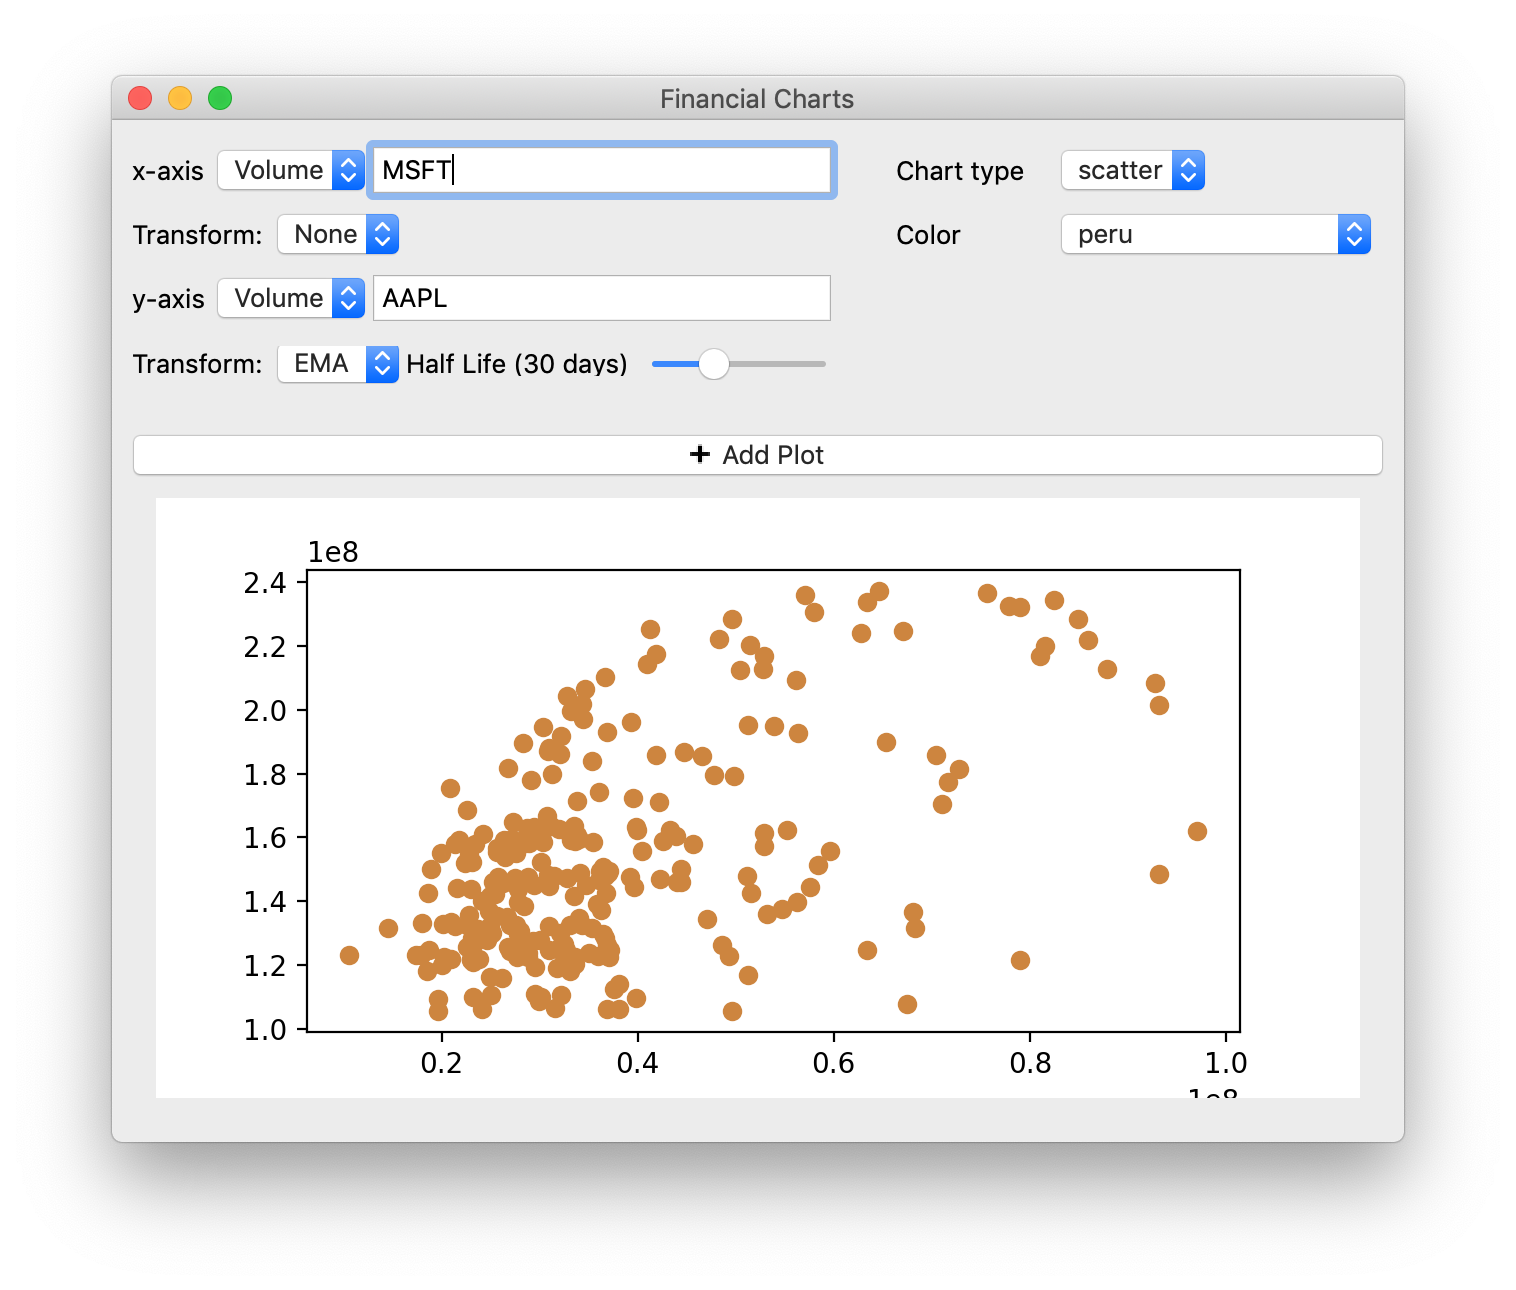
Financial Charting
In this example, we create a reactive charting application with Edifice. We allow arbitrary number of plots to be made on the same axis. For each plot, the source for the x-axis and y-axis data can be specified by the user. The source data could be the date, the close price, or the volume of a stock. The data in each axis can also be transformed by an EMA operator, which computes a moving average over the past n days (with n adjustable by a slider). And of course, everything is reactive — there’s no “plot” button that the user needs to press to render the chart.
All this is possible in under 200 lines of code and straightforward logic: there’s an underlying description of everything that is plotted. This description is shown to the user in two ways: the “textual” description via dropdowns and input elements, and a visual rendering in the form of a graph. Users can interact with the textual display and thereby update the plot description.
The code is available here.
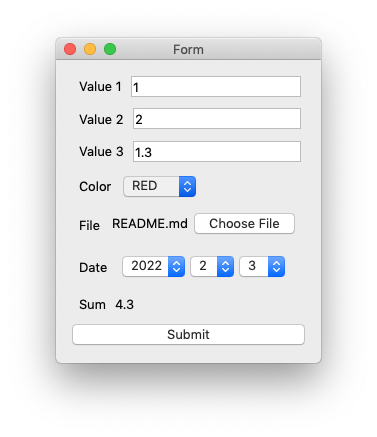
Forms
An example to show how the Form component makes creating routine UI for simple forms extremely simple. The Form component creates input elements for data in a type specific way: for example, strings would correspond to text inputs, enums to dropdowns, datetime.dates to three dropdowns (with the right number of days for each month), etc. You can also pass a function, which would generate a label whose content is the function evaluated on the inputs.
The Form component was created using the same high-level Edifice api provided to users, so its source code is technically another example!
The code is available here.
Harmonic Oscillator
An example showing animation. The animation was rendered at 30 FPS (the GIF is only at 12 FPS so you won’t be able to tell). You can interactively set the frequency and damping factors and instantly see the result, both in a graph and in the animation. Python of course has great numeric libraries, so we can work with complex numbers.
The code is available here.